
Google Docs Report Template for Quarterly and Monthly Reports
Prefer a file? Download .docx · Download PDF
How it works: “Use this template” opens Google’s copy screen. Sign in to your Google account and the document is copied to your own Drive, where you can edit every line. Need help copying the document?
What's inside the Google Docs report template
-
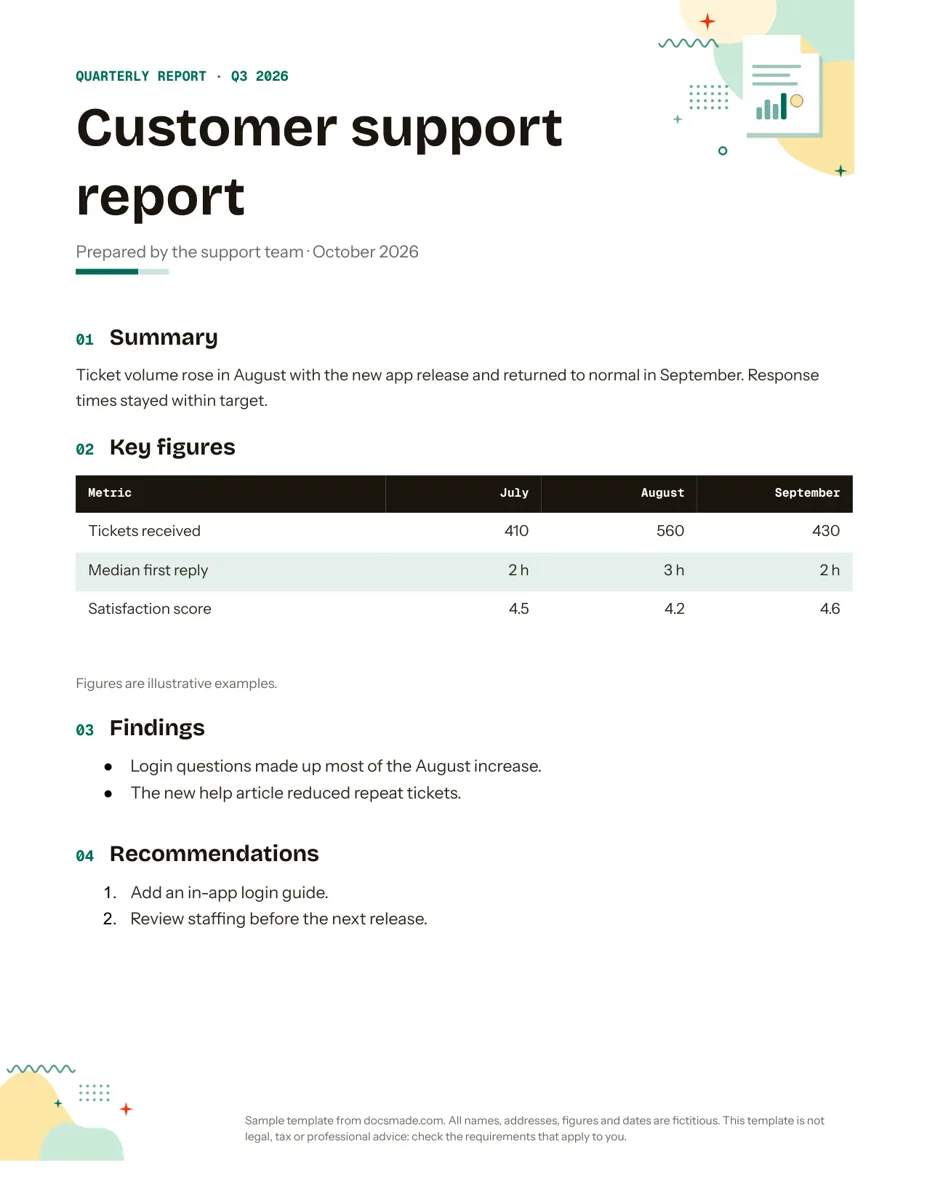
Summary
-
Key figures
- Table: Metric, July, August, September
-
Findings
- Login questions made up most of the August increase.
- The new help article reduced repeat tickets.
-
Recommendations
- Add an in-app login guide.
- Review staffing before the next release.
This Google Docs report template gives you a short, structured business report: a summary, a table of key figures, your findings and a numbered list of recommendations. It suits team leads, small business owners and anyone who has to tell a manager or a client what happened last month or last quarter. It is a real Google Doc, so you can preview it first and then make your own copy in one click.
What's in this report template for Google Docs
The sample is a quarterly customer support report for Q3, written for a fictional support team. Every part is there to show the shape of a good report, and all of it can be rewritten for sales, marketing, operations or a school project.
- Header band and title. A colored band reads "Quarterly report · Q3 2026", followed by a large title and a line saying who prepared the report and when.
- Summary. Two sentences that give the whole story before any numbers: volume went up in August, came back down in September, and response times stayed on target.
- Key figures table. Four columns (Metric, July, August, September) and three rows: tickets received, median first reply and satisfaction score. Numbers are right-aligned so they line up, and a small note under the table marks the figures as examples.
- Findings. A bulleted list that explains what the numbers mean, for example that login questions caused most of the August increase.
- Recommendations. A numbered list of next steps, such as adding an in-app login guide and reviewing staffing before the next release.
The page is set to US Letter, with numbered section headings, a small decorative illustration in the top corner and a footer note. Everything fits on one page, which is the length most readers will finish.
How to write a business report with this template
A report is read by busy people, often on a phone, so the order of the sections matters more than the design. Work through the template from top to bottom:
- Write the summary last, but keep it first. Once your table and findings are done, go back and describe the period in two or three sentences. If your reader stops there, they should still know whether things went well.
- Pick three to six metrics. Choose the numbers your reader already cares about and keep the same ones from report to report, so trends are easy to spot. Put units in the cell ("2 h", "$1,200") rather than in a footnote.
- Turn numbers into findings. A finding answers "why did this change?" Avoid repeating the table in words. "Ticket volume rose 37%" is a figure; "login questions after the app release drove the increase" is a finding.
- Make recommendations specific. Each item should be an action someone can own. Add a name or a date in brackets if that helps.
Common mistakes are mixing periods in one table, leaving out the source of the data, and adding long paragraphs of background. If you need the background, put it at the end under its own heading.
How to customize the report template in Google Docs
Open the preview and click Use this template, or go to File > Make a copy if you already have the Doc open. Your copy lands in your own Google Drive and the original stays untouched. If the button does not work for you, our guide on how to copy a Google Doc covers the usual causes.
- Change the title and band. Click into the colored band and type your own period, such as "Monthly report · March". To change its color, click inside the cell and use the fill color button on the toolbar.
- Edit the table. Right-click a cell and choose Insert row below or Insert column right to add a metric or a month. Format > Table > Table properties lets you change borders, cell padding and background colors.
- Fonts and colors. Select text and use the toolbar font menu, or set a heading once and use Format > Paragraph styles > Update to match so every section heading follows.
- Illustration and footer. Click the corner illustration and press Delete to remove it, or right-click it and choose Replace image to add your logo. Double-click the footer to edit or clear the sample note.
- Paper size. File > Page setup switches between Letter and A4 and also changes margins and orientation.
To add a chart, use Insert > Chart. You can create a new bar or line chart (Google Docs opens a linked sheet for the data) or pick From Sheets to bring in a chart you already built in Google Sheets.
Print, export and share your report
To print, use File > Print. To send the report as a file, go to File > Download and choose PDF Document (.pdf) for a fixed layout or Microsoft Word (.docx) if your reader works in Word. You can also download the .docx and PDF straight from this page without copying the Doc.
Often the easiest option is to share the Doc itself. Click Share, add people by email or set General access to "Anyone with the link", and choose Viewer, Commenter or Editor. Reviewers can select a sentence and use Insert > Comment to ask questions, and File > Version history lets you see who changed what before the report goes out.
Other uses: status, progress and monthly report templates
The same four sections cover most routine reports. A few ways people adapt it:
- Project status report. Rename "Key figures" to "Milestones" and use columns for task, owner, due date and status. Keep the findings for risks and blockers.
- Monthly report template. Keep the table, but use the last three months as columns so each new report shows a short trend.
- Progress report for a client or grant. Turn the summary into "what we promised and what we delivered" and list next steps under recommendations.
- School or club report. Swap metrics for event attendance, funds raised or volunteer hours.
If the report needs a formal cover note for a manager, pair it with our memo template. When the next step is asking for budget, the proposal template picks up where the recommendations end, and the meeting minutes template records what was decided when the report is discussed. You can browse more business templates in the same style.
Google Docs report template FAQ
Is this report template free to use for work?
Yes. You can copy it, change it and use the result for your own business, client work or school reports without paying or signing up. All the names and numbers in the sample are fictional, so replace them before sharing.
Can I add a table of contents to a longer report in Google Docs?
Yes. The section titles are styled as headings, so Insert > Table of contents builds one automatically. If you add sections later, click the table of contents and use the refresh icon to update it.
How do I keep the report on one page?
Trim the findings to the two or three points that matter most, and reduce table padding in Table properties. File > Page setup also lets you make the margins slightly smaller without hurting readability.
Will the report look the same in Microsoft Word?
The .docx keeps the sections, table and lists. If Word does not have the same fonts installed, it substitutes similar ones, so line breaks can shift slightly. Export to PDF when the layout has to stay exactly as it is.
Can I reuse it as a weekly report template?
Yes. Make one clean copy, rename it something like "Weekly report master" and leave the table empty. Each week, make a copy of that master, so you never overwrite last week's numbers.
More templates
-
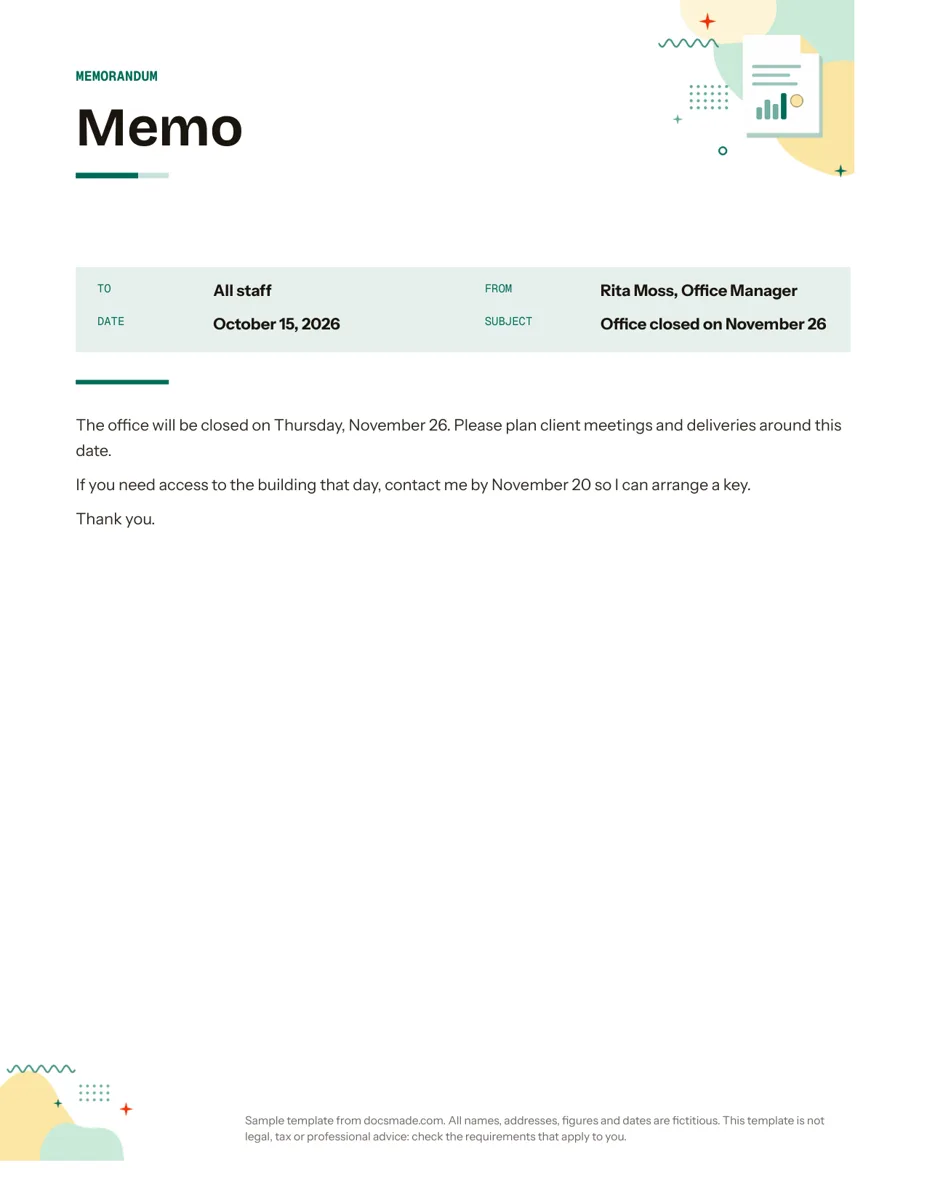 Business & finance Google Docs Memo Template for Office Announcements Free business memo template for Google Docs with To, From, Date and Subject lines. Preview it, make a copy, or download as .docx and PDF. View template →
 -
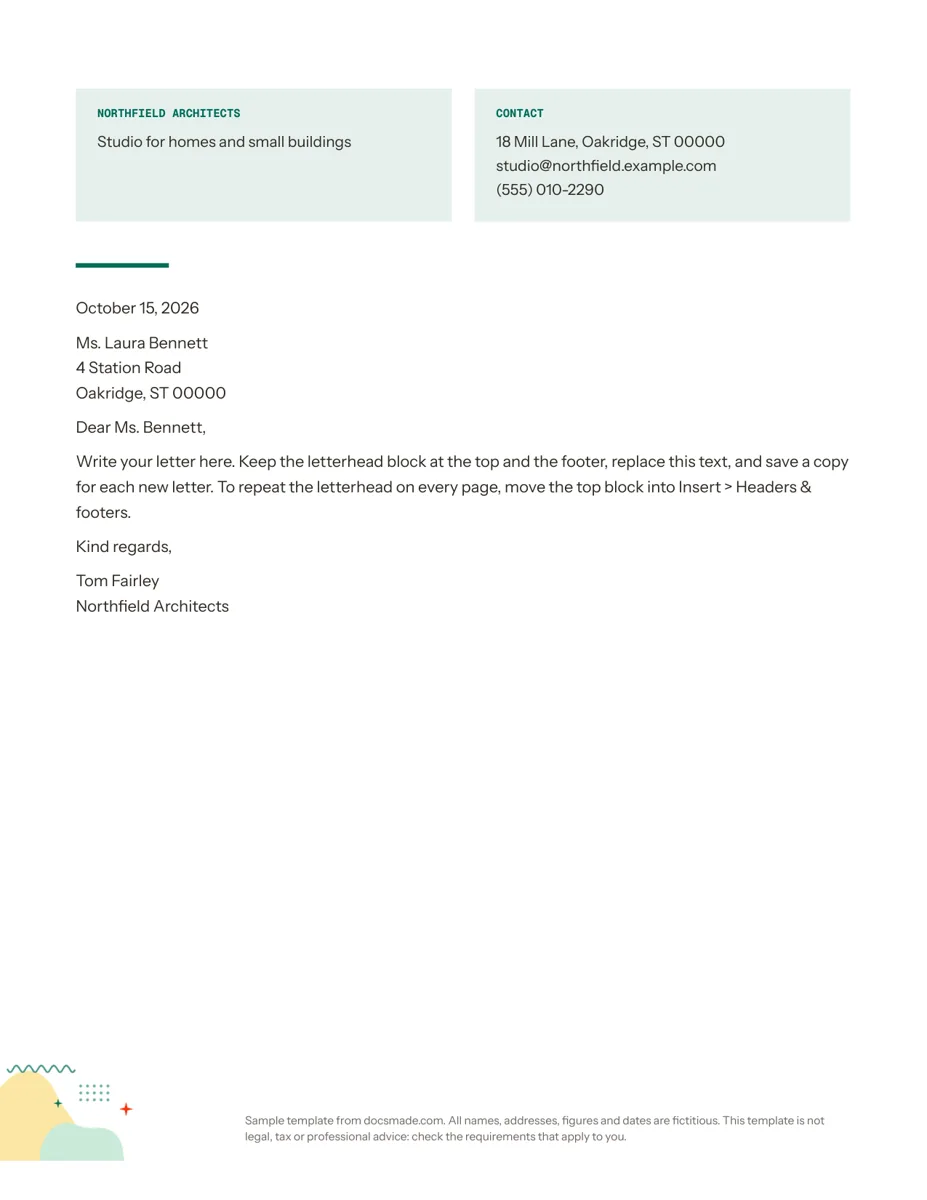 Business & finance Google Docs Letterhead Template for Business Letters Free business letterhead template for Google Docs with company and contact block. Real Doc: preview it, make a copy, or download .docx and PDF. View template →
 -
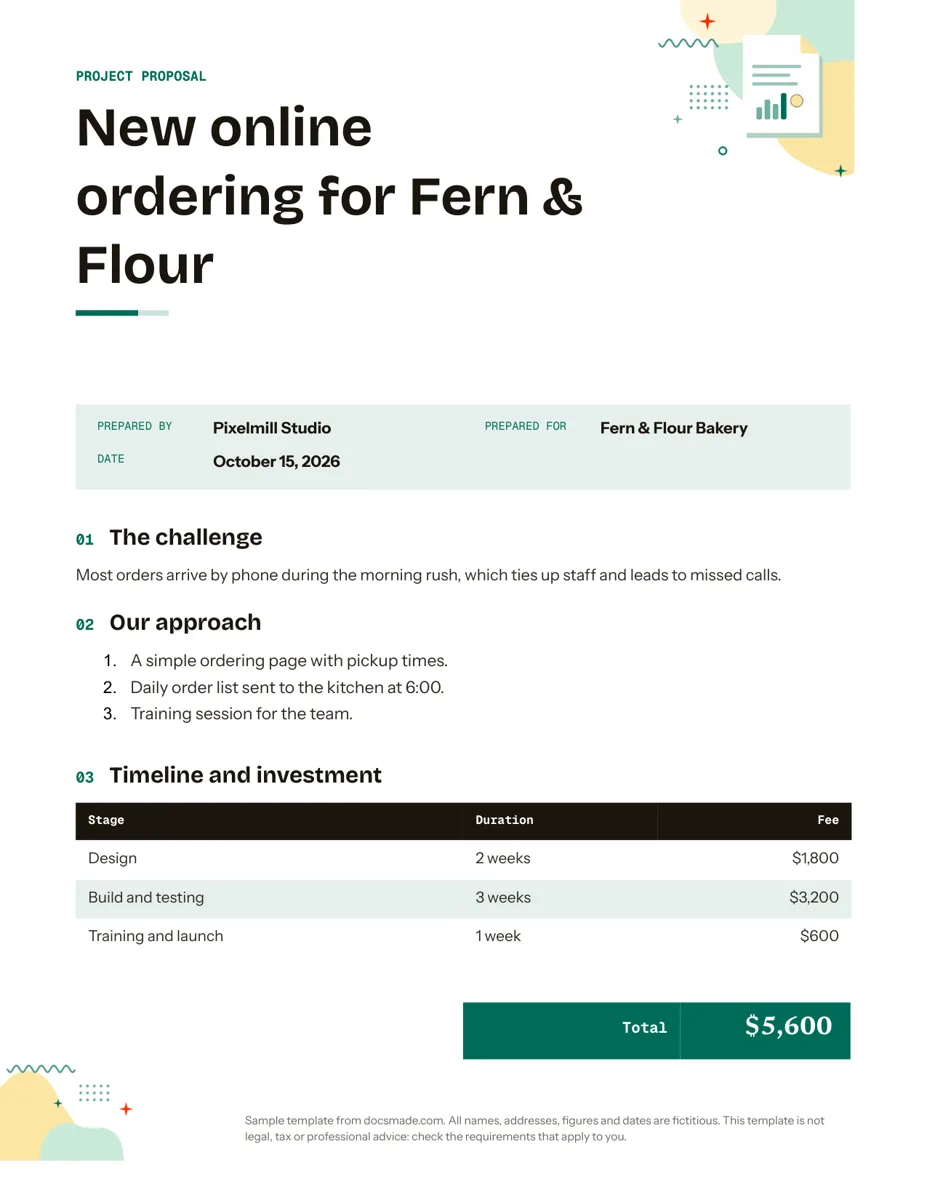 Business & finance Google Docs Proposal Template for Client Projects Free project proposal template for Google Docs: challenge, approach, timeline, fees and next steps. Preview, make a copy, or get .docx and PDF. View template →
 -
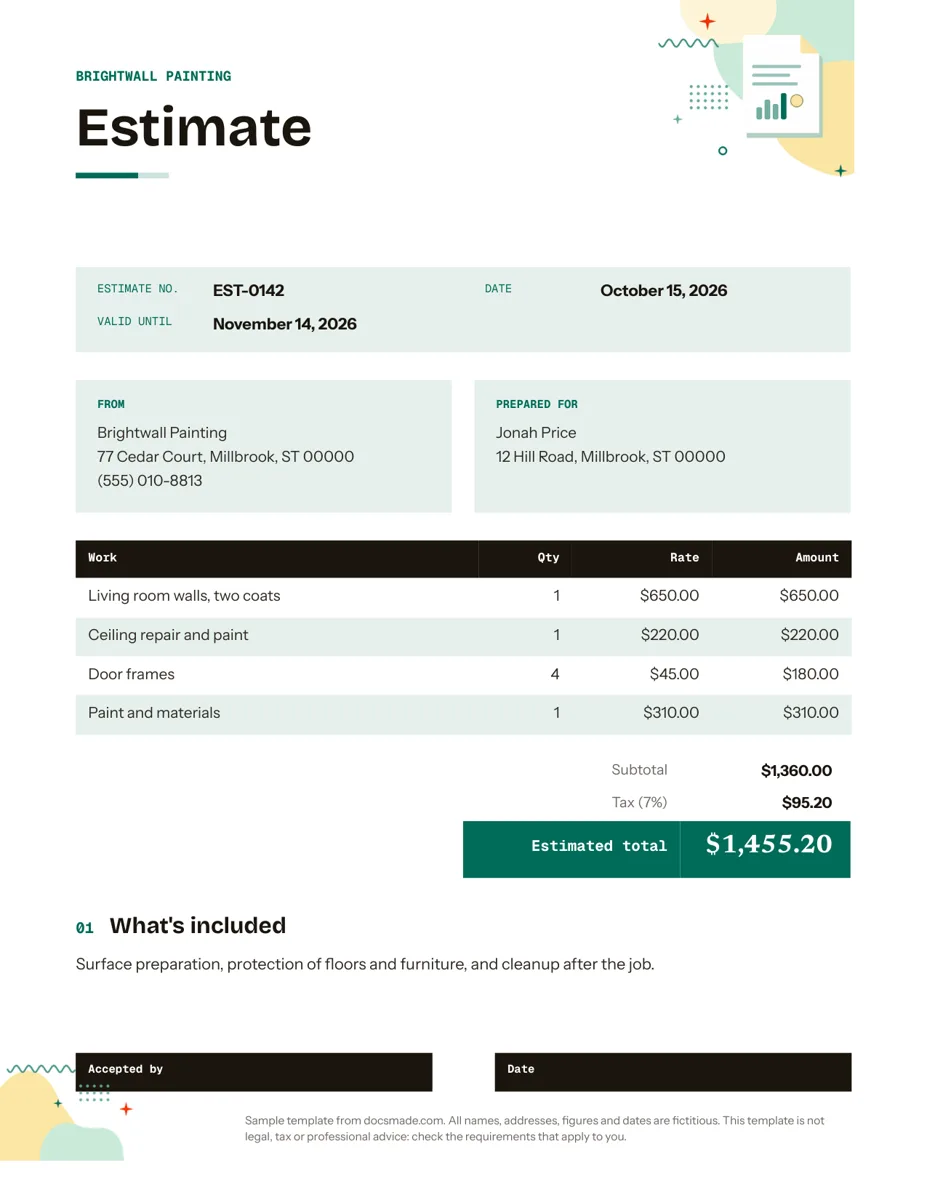 Business & finance Google Docs Estimate Template for Quotes and Jobs Free job estimate template for Google Docs with line items, tax, validity date and a sign-off line. Preview, copy, or download .docx and PDF. View template →